Discover Residential Property Trends with Smart Location Analysis
At Smart Location Analysis, we
strive to deliver in-depth, data-driven insights for our users. In this post
we'd like to highlight one of the key features of our service: access to the
Residential Property Register for any chosen location. Whether you're
researching for a new home, investment property, or just want to better
understand the housing market in an area, our tool provides critical insights
with just a few clicks.
Here’s how you can easily get the Residential Property Register details in our
reports:
1. Choose Your Location by droping a pin on the map or searching for the
location.
2. Define Your Catchment around your location by setting a travel type (e.g.,
driving) and a time (e.g. 10-minutes).
3. Optionally Explain Your Interest in the Location.
4. Select Residential Property Data from the Property section.
5. Confirm Your Email and Receive Your Report a short while later.
What You’ll Get in Your Report:
1. A narrative summary explaining the charts and maps related to the
Residential Property Register.
2. A catchment map showing the area you’ve defined for analysis.
3. A five-year graph displaying the number of property entries in the Register
for your catchment.
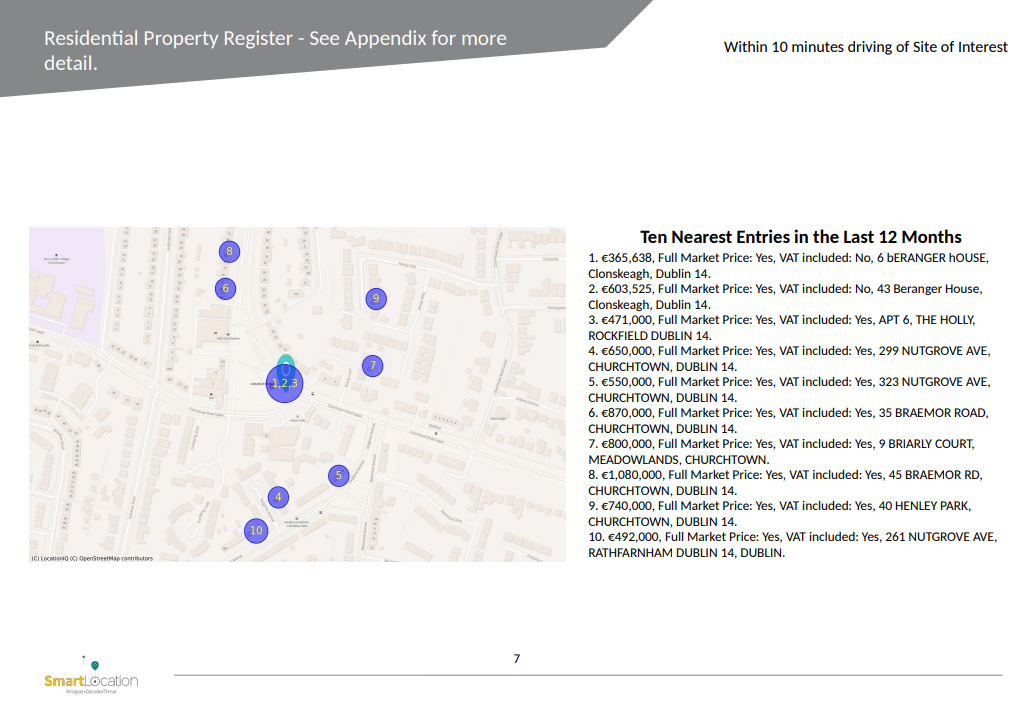
4. A map and table showing the nearest 10 property entries, complete with key
details such as price, address, whether it was a full market transaction, and
whether VAT was included.
For users who are comparing two locations, the report will provide the same
data for both, along with a narrative comparing the residential property trends
in each area.
Whether you're researching the property market or simply curious about a
specific location, Smart Location Analysis makes accessing the Residential
Property Register easier and insightful. Give it a try today and gain a better
understanding of the property landscape!
Head over to Smart Location Analysis at https://www.smartlocationanalysis.com and get started!